A desktop app on my Windows machine started dying one second after launch. No error dialog. No crash message. The window appeared, then vanished.
That day it died twelve times.
I reinstalled it with the latest version. It died in one second, with the exact same exception.
That reinstall is the part worth writing about. It felt like a dead end, and it was actually the single most useful piece of evidence I got. Here is the whole path, in the order I walked it.
(The app was pCloud Drive, but nothing below depends on that. The method works for any Windows app that dies without leaving a log.)
Guessing from memory is worthless. Memory is not a record. Windows keeps one, so I read it first.
Get-WinEvent -FilterHashtable @{LogName='Application'; ProviderName='Application Error'; Id=1000; StartTime=(Get-Date).AddDays(-14)} | Where-Object { $_.Message -match 'AppName' }
Twelve crashes came back. All of them on the same day. Going back fourteen days, there were none before that.
One note that will save you confusion: filter on Application Error (ID 1000). A single crash also produces one record from Windows Error Reporting (1001) and one from .NET Runtime (1026). Query all three providers and your count triples.
Then I checked the app's own log. It had been writing a heartbeat message every hour, and the last healthy one was at 05:54:59. The next one, due at 06:54, never came. The first crash sits between them at 06:15:33.
So the app was completely healthy twenty minutes before it started dying, and after that it died every single time. Not a slow degradation — a switch that flipped. That distinction matters, because it changes what you are hunting: not a state that drifted, but an event that happened.
0xc00000050x0000000000000000unknown[0x8, 0x0]Most people skim past this block. Read it and the search space collapses.
The exception address is zero. Something tried to execute code at address 0. There is nothing there.
The first parameter is 0x8. That field describes the kind of access: 0 is a read, 1 is a write, and 8 means an instruction fetch — a branch to an address that cannot be executed. On x64 with DEP enabled, branching to an unmapped address like 0 also lands in this bucket. The second parameter, 0x0, is the address that could not be accessed.
Put together, the most natural reading is a null function pointer being called. A variable that should hold the address of a function was empty, and the code jumped to that empty address.
It is worth being precise here: a corrupted stack that puts a zero into the saved return address produces the identical signature. Those two causes cannot be told apart from this evidence alone. What settles it comes later.
And unknown as the faulting module is expected. Address 0 is not inside any DLL's range.
One more thing about Fault offset: it normally holds an offset from the faulting module's base, not an absolute address. Here the module could not be resolved, so it happens to hold the absolute value. If you want the address itself, the .NET Runtime record states it explicitly as exception address 0000000000000000.
The app is a .NET (WPF) application and writes its own log. Here is the moment it died.
10:47:48 INFO start / 10:47:48 INFO Set tray baloon / 10:47:48 ERROR Show main window / 10:47:49 INFO CRYPTO_STATUS_NEW / (ends)
There is one ERROR line, but its content is "Show main window" — it appears on every launch and has nothing to do with the crash. What is missing is any record of an exception.
This app had logged a FATAL with a full exception type and stack trace when it hit a different bug months earlier. So the machinery works. It just produced nothing this time.
Windows did record something, from .NET Runtime:
Description: The process was terminated due to an unhandled exception. Exception Info: exception code c0000005, exception address 0000000000000000
No exception type name. If a .NET exception had gone unhandled, the type and stack trace would be sitting right there. Instead there is a raw SEH code and nothing else.
That points at a hardware exception in native code rather than anything the managed layer would recognize. It does not prove it — the stack analysis later does that — but it decides which layer to suspect first.
PRAGMA integrity_check returned ok. The file is not damagedThat "the file is not damaged" line comes back later. Hold onto it.
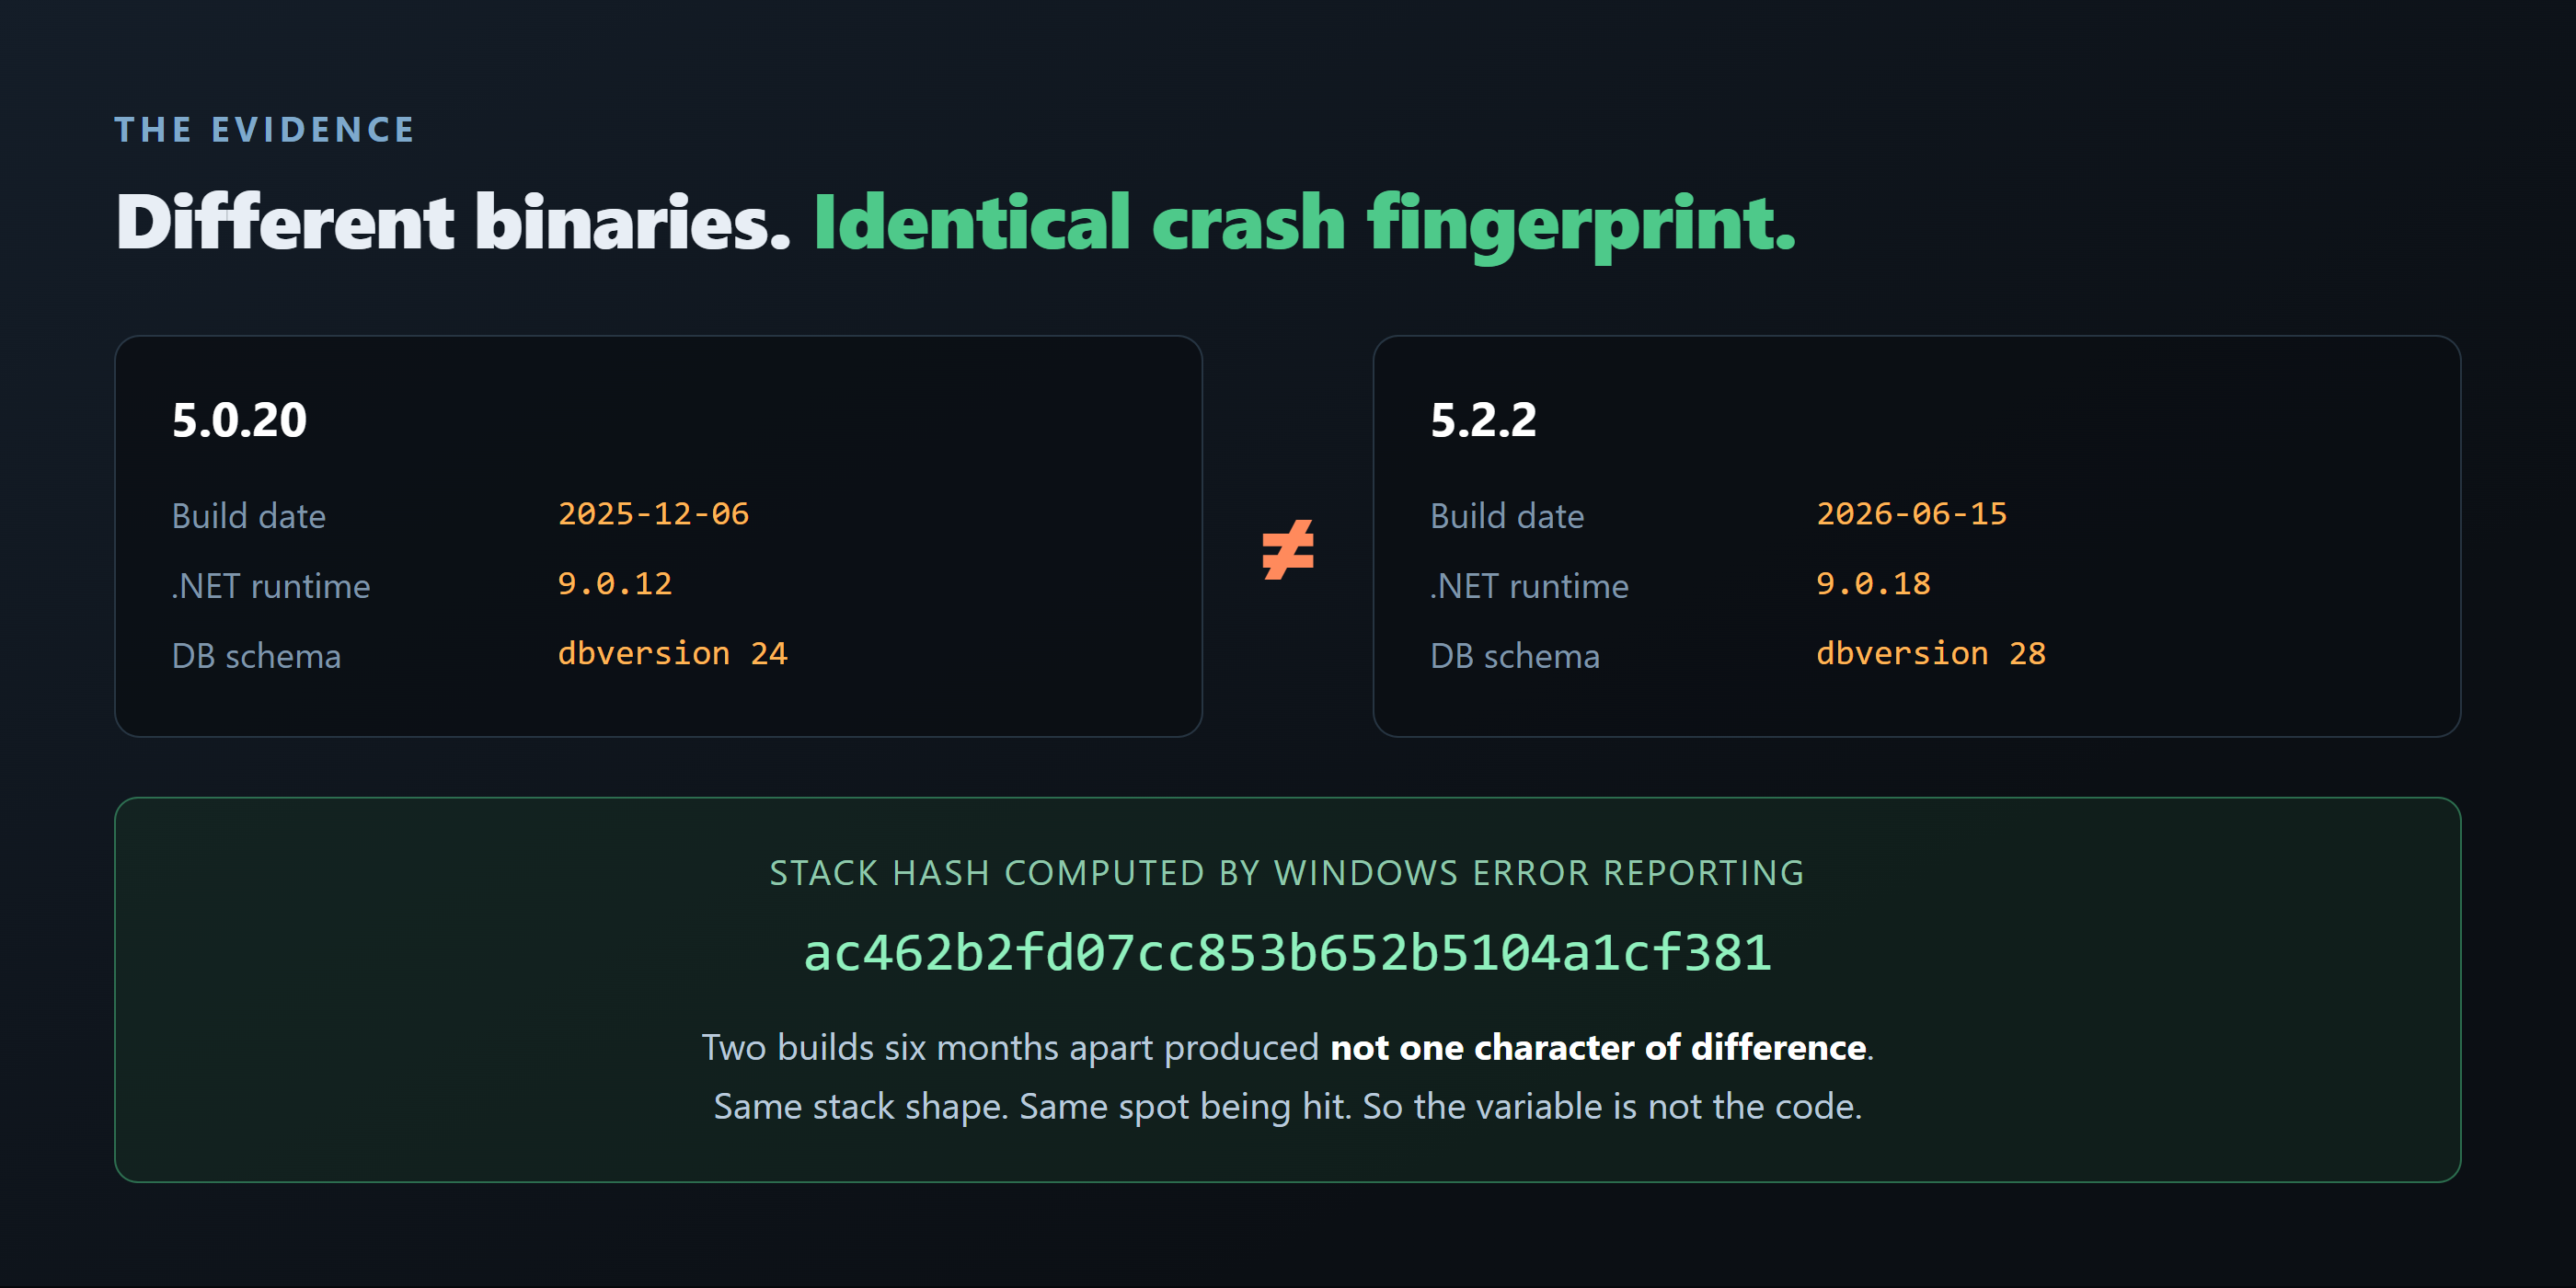
Then I did what everyone does first. The app was on 5.0.20, so I installed the current 5.2.2 over it. The release notes mentioned "recovery of interrupted file transfers" and "a new management system for failed upload items" — exactly the sort of thing that should have helped.
Install succeeded. Launch.
Dead in one second. Same exception.
This is the turn, and it is not a story about frustration. It is about counting what actually changed.
dbversion 24 → dbversion 28The application binary and the runtime underneath it were both replaced with different versions, built six months apart.
And yet it died after one second, with the same exception, in the same way.
Then I compared the crash fingerprints, and this is the piece that closed the case.
ac462b2fd07cc853b652b5104a1cf381 → ac462b2fd07cc853b652b5104a1cf3810000000000000008 → 0000000000000008Not one character different.
When a process dies, Windows Error Reporting computes a hash from the stack at the crash site. Replace the executable with a different build and the code moves, so this value normally changes.
It didn't.
Two binaries with six months of changes between them, producing an identical fingerprint. Same stack shape, same spot being hit.
If you swap out the code entirely and the symptom does not move by a millimetre, then the variable is not the code. The only suspect left is the data the app reads.
And the new version had migrated that data to a new schema on the way in, and still died. So what I was looking for was something the app carried across the migration.
Knowing it was "the data" still left the question of which data. I needed the crash site.
The newer version writes a minidump into a crashes folder. There was a 1.4 MB dump sitting in it.
There is a trap here. By the next launch, that folder was empty — the app sends the report and then deletes the dump itself. If you find one, copy it before you do anything else.
I had no debugger installed. A Python library is enough.
pip install minidump
Four steps:
You do not need symbols for this. Counting alone tells you which module dominates. Here is what I actually ran:
mods = sorted(((os.path.basename(m.name), m.baseaddress, m.baseaddress + m.size) for m in mf.modules.modules), key=lambda x: x[1])
th = [t for t in mf.threads.threads if t.ThreadId == mf.exception.exception_records[0].ThreadId][0]
data = raw[th.Stack.Rva : th.Stack.Rva + th.Stack.DataSize]
hits = [owner(struct.unpack('<Q', data[i:i+8])[0]) for i in range(0, len(data)-7, 8)]
One implementation note: reading memory through mf.get_reader() throws the moment you touch an address the dump didn't capture. Slicing the file directly using th.Stack.Rva is reliable.
The result:
Reading bottom to top: ntdll → kernel32 → msvcr100 (thread startup) → pthreadVC2 → pSyncLib.dll.
pSyncLib.dll is the app's native sync engine — the component whose entire job is moving files to and from the cloud.
This counting method needs caveats, and none of them change the conclusion. It does not mean twenty-six nested calls. Stacks get reused, so stale values left by calls that already returned are mixed in, and pointers to data are counted too. What it tells you is what the thread was busy with. Twenty-six against seven is not a close call.
The part that mattered most: neither the rendering DLLs nor the resident software I had suspected of interfering appear on that stack even once. Not a UI problem, not third-party interference. A worker thread inside the sync engine, dying on its own.
The sync engine keeps a work queue in a local SQLite database. That is where it was dying.
fstask — 5fstaskupload — 73fstaskdepend — 1fstaskfileid — 0All of them at status=0 — untouched. Every one pointed at a partially-written temporary file in the same folder.
The timeline fits:
06:09 an 843 MB temp file last modified / 06:11-06:14 the app's local cache last modified / 06:15:33 first crash
I had pointed a downloader straight at the sync folder, which this app mounts as a virtual drive. The app dutifully tried to upload a file that was still being written, and somewhere in the middle of that the file was renamed or the transfer was interrupted, leaving the queue in a state it could not process. That last part is my inference — I never observed the race itself.
What I did observe is narrower: with these tasks in the queue it dies every time, and with the queue emptied it doesn't. Whether the rows themselves are malformed, or the rows are fine and the code path that handles them has a hole, I cannot tell. The fix is the same either way.
And here is where "the file is not damaged" pays off. The integrity check returned ok because all it inspects is page structure and schema. "This data makes the application die" is a category of problem it cannot catch by design. A file being intact and a file being safe are different claims.
Step 3 is the one that matters. Writing them out first means you can undo the decision. (I didn't need to, but I didn't know that when I made it.)
It launched. It stayed up. The virtual drive mounted normally, twelve minutes of monitoring produced zero crashes, and it was still running — with Explorer's context-menu integration responding, which requires the app to be alive — long after.
What was lost were interrupted uploads. Nothing that already existed in the cloud was affected.
If a reinstall doesn't fix it, the next thing to open is the app's data folder, not the uninstaller. On Windows that means under %APPDATA% and %LOCALAPPDATA%. Swapping out the executable and getting the same symptom is not a failed attempt — it is a result that eliminates half the suspects.
If it dies silently, go looking for a dump. Check whether the app writes one itself. If not, Windows can be configured to save one via the LocalDumps registry key. And be quick — some apps delete their own dumps after reporting.
A stack tells you where to look even without symbols. Counting which module dominates is enough to pick your next move.
Don't point a downloader at a cloud-sync mount. Let it finish on a local disk, then copy. Files that are still being written have no business inside a folder something else is watching.
This app has a real defect. Whatever is in that queue, branching to address zero and dying instantly — null function pointer or corrupted stack, either way — is inadequate defence. That is the vendor's to fix.
But waiting for that fix doesn't get your machine working.
I have been thinking about it this way: the number of people who can build things is going to keep going up. What isn't going up is the number of people who, when something stops working, can draw the line between what is innocent and what is a suspect. The forty minutes this took were made entirely of drawing that line.
The investigation above was carried out by an AI agent (Claude Code). Here is everything I entered, in full.
First: the pcloud app keeps force-quitting
That's it. No version, no error text, no mention of when it started. From there the agent queried the event log, decoded the exception, identified the onset time, and reproduced the crash on its own.
Second: presented with four options — update to the latest version, park the sync queue and test, file with the vendor, or examine the unsynced data first — I picked the first.
Third: installed it
When the latest version died the same way, the agent found the dump in the crashes folder, ran pip install minidump, analysed the stack, and identified pSyncLib.dll.
Fourth: asked for permission to park the queue, I approved it.
That recovered the machine.
I gave no technical instructions. Which log to read, how to parse a dump, which table to suspect — none of that came from me. I chose which hypothesis to kill first, and that was the whole of my contribution.
Which makes the remaining human job fairly clear:
The agent can investigate something to the end. It cannot decide what you can afford to lose. That division is the thing I actually took away from this.